Opinion
CASE-Ross Survey 2021: seeing the wood for the trees
by Siôn Lutley - 7 May 2021
More Partnership’s insight team takes its traditional deep-dive into the CASE-Ross Support of Education Survey: United Kingdom and Ireland 2021.
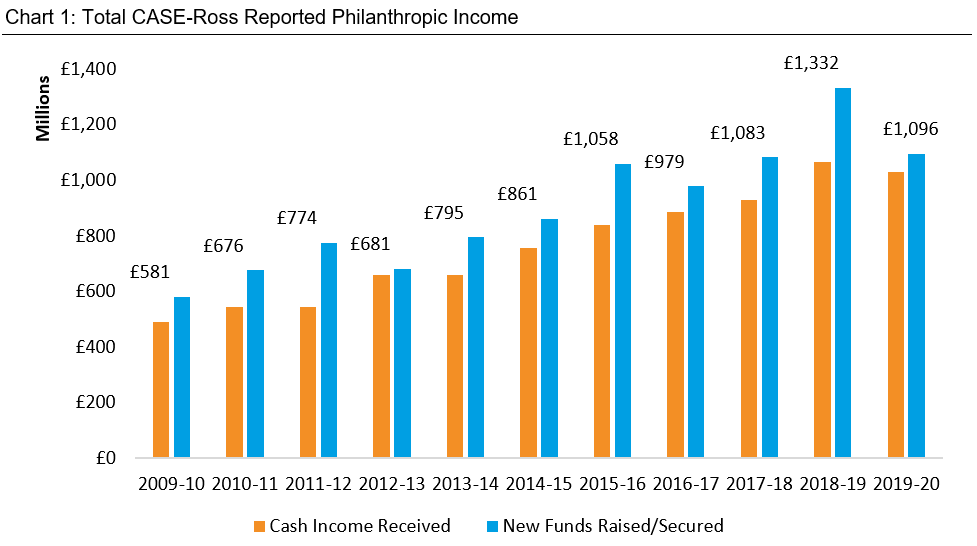
The CASE-Ross 2021 Report is out, and with it came a very positive introduction from the Editorial Board, stating that “The overall story of the year, including those challenging early months of the pandemic, is strongly positive… Strong momentum would seem to have been maintained.” An upbeat assessment perhaps for a year when the overall total funds secured was a not-insignificant £236m lower than the previous year.
Whereas the THE’s interpretation was a slightly starker, “UK and Irish universities’ fundraising income drops 17 per cent.” Possibly even more than ever, the picture is unclear, complex and/or nuanced.
The More Partnership team have gone into their annual (virtual) huddle around the report to see what insights we can draw from this year’s data.
First, we’ll start with the obvious observation that it is covering a year that had five months severely impacted by COVID and lockdown. Second, the survey may have five new/returning institutions but 10 others are absent, including one Russell Group, so the headline results are certainly not comparing like-for-like. Third, regardless of annual fluctuations, the long-term trends for total funds raised/secured and cash received are still upwards, even if the ones for donor numbers are less clear.
There’s lots of data and possibly more questions than answers – so what do we make of this year’s report?
Some old faces return to the survey but even more are absent…
Many advancement seeds were sown in institutions a decade ago, encouraged by the Government’s match funding schemes of 2006-2011, but long gone are the days when 151 HE institutions participated in the 2012 CASE-Ross survey. Worryingly, the steadily decreasing response rate for survey participation has continued. It’s down from 127 to 96 institutions over the past six years, with some fairly noticeable absences this year.
Yes, submitting results during the middle of a pandemic will have been challenging, but Durham, Aberdeen, Birkbeck, Ulster and Leicester are not small or new Advancement operations and yet they’re missing.
Others have reappeared, and that’s to be welcomed, even if it points towards the continued curse of stop:start in some institutions. For whatever reason, it’s a shame to have so much variation year-on-year.
…and there’s been a shuffling of the survey’s groupings
In addition to the changing and diminishing number of participants, there has been a fairly significant change to the cluster group allocation, especially with a dramatic jump in the number of ‘Fragile’ institutions from 2 to 11, the largest number in this cluster since it was introduced almost 10 years ago. The Report’s foreword states that this shouldn’t be taken as a significant sector shift, but it’s unsurprising that the THE highlighted this change.
Overall, this shuffling of the deck combined with variable participation in the survey makes comparison, if not trickier, then more opaque. Even if the multi-year trends are comparing like with like, whether you’re looking at sector, mission or cluster, the number and make up of almost every group has changed from previous years.
We believe that if you add to this reallocation the number of (mainly smaller) operations that are no longer reporting data, this change – even if warranted – does reflect a growing fragility across the sector, and in an area where consistency of approach (whether in fundraising or alumni engagement) is so important.
Yes, there is obviously resilience and improved performance among some cluster groups, but (to use a cricketing phrase) the sector has an increasingly ‘long tail’ and this aspect should be of growing concern to the sector as a whole.
This means that the apparently stellar growth of 63% by this year’s Developing institutions in their levels of funds raised must be balanced against the falls of 58% and 56% seen by the new Emerging and Fragile groups. Some mid-range institutions have clearly performed exceptionally well but it’s difficult to get a clear picture with the high number of relegated institutions – and that’s before you throw COVID into the mix.
Oxbridge continues to dominate trends but the rest of the Russell Group pack has closed the gap
As in previous years, Oxbridge’s ups and downs dictate the survey’s headline results in a way that clouds other more significant trends across the broader landscape.
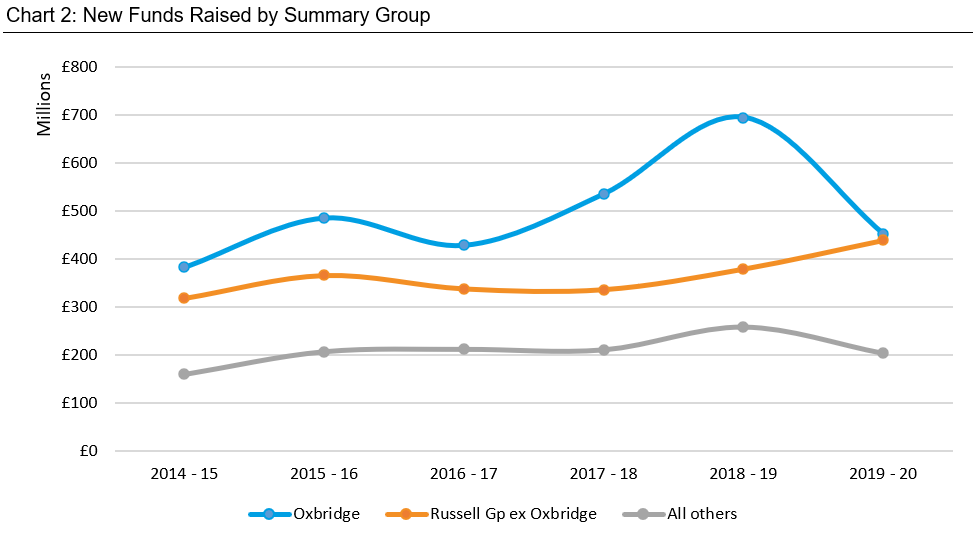
The overall drop of £236m in this year’s headline figure to £1,095m could be seen as being entirely down to Oxbridge’s fall of £242m. It is, and if Oxbridge had two more nine-figure gifts pledged this year, then we’d quite possibly be telling another story. Chart 2 (below) shows the dramatic equalising in 2019/20 of Oxbridge’s total raised when compared to the rest of the Russell Group. After several years of the gap growing to a peak of £315m last year, it dropped to under £14m.
However, with the largest reported pledged gift from the two Elite institutions being only £6m, the average largest pledge for the Established group (a subset of the leading RG institutions) was more than twice this level at £14.7m – so they won the battle of the big gifts this year, although you can’t help but feel that this is temporary and Oxbridge will be back in 2020/21.
Outside Oxbridge, the picture seems more balanced – or maybe mixed would be a better descriptor. The non-Oxbridge Russell Group institutions, as a whole, had a strong year, especially when you consider Durham’s absence from its results. The remainder of the sector has not, overall, been so positive, but with quite a few absences, plus a world-wide pandemic, is any dip in income that unexpected? The total funds secured for the non-RG institutions is still at a similar level to the three years of 2015/16 - 17/18 (i.e. just over £200m), so the average raised per institution has actually increased, looking at the medium term.
However, any top-line or group figures hide a great deal of variation between individual institutions, as More’s own survey into fundraising during the pandemic highlighted.
Donor numbers may be up this year, but is this the longer-term trend?
A positive note from this report is that the headline donor numbers have risen. This year’s figure for the total number of donors (214k) is still some way off the high watermark in the 2018 Report (2016/17 data) of 246k but again, longer-term trends are made more opaque by falling participation numbers: the 2018 Report’s figure representing 108 institutions compared to this year’s 94 (submitting data against this heading).
However, unlike total funds raised/secured (which has a positive longer-term trend, even if dipping this year), we may have seen the peak for the sector’s total donor numbers in 2017/18 (see Chart 3 below). Are we seeing the start of a longer-term fall in donor numbers, as seen in North America, or is this part of a temporary blip? Only time will tell.
Looking at this year’s group data on donor numbers, the Elite and Established universities have reversed, almost exactly, their respective 2% and 10% dips in the 2018/19 year. This contrasts with much more mixed outcomes from the Developing/Emerging/Fragile institutions. However, it was another good year from the ‘Moderates’, whose (mean) average number of donors was up 10% – with the caveat that we could just be looking at those institutions that have prospered while others falter out of the limelight.
Our sense from More’s long-standing regular giving benchmarking and our work with many UK HE programmes is that many institutions achieved donor number increases through emergency appeals. These brought in new alumni donors as well as non-alumni ones. The pandemic inspired some exceptional giving as donors turned to universities for answers and, perhaps, a way of combatting their own helplessness in lockdown. The work of universities on vaccines etc. also brought to the fore the contribution that they make to the world and allowed some institutions to broaden their case for support for mass fundraising to include research.
If stewarded well, these new donors will give again and may help to bring donor numbers back to the higher pre-COVID levels.
Data, data everywhere…
As usual, there is a great deal of data on the level of investment in fundraising and alumni relations. However, due to the timing of the survey, we can’t be sure from the data itself what is the result of pandemic-inspired budget cuts or part of a longer-term trend.
Hopefully the enforced belt-tightening will be short-term and primarily reflect reduced events and travel during 2020. More’s Covid survey reinforced our view that what impacted institution’s fundraising performance was more about the way they reacted rather than the ability or willingness of potential donors to give.
And finally...
So what, if anything, can we learn from the CASE-Ross 2021 Report?
The immediate shock of the pandemic and subsequent impact on fundraising and alumni engagement activity and budgets was severe, but does the data in the 2021 Report reflect what happened and in a way that we can draw any firm conclusions from?
We’re not sure it does – although it’s important to add that this isn’t a fault of the Survey itself. It’s been a confusing year and it’s likely that 2020/21 will be too. Even with its various sector group changes, the CASE-Ross Survey provides the best insight into, and benchmark for, the philanthropic health and performance of the UK’s Higher Education sector. We’d be much less certain what was going on without it, so here’s hoping that the falling participation rate can be reversed.
Possibly for the last time, we’ve updated the chart we first produced for the Pearce Report in 2012, showing the forward trends required to reach, by 2022, the sector’s goals for philanthropic revenue and donor numbers. The absolute accuracy of this chart is a little subject to the ups and downs of participation in the survey itself, but most of those raising the most, and acquiring the most donors, are represented in each year of data.
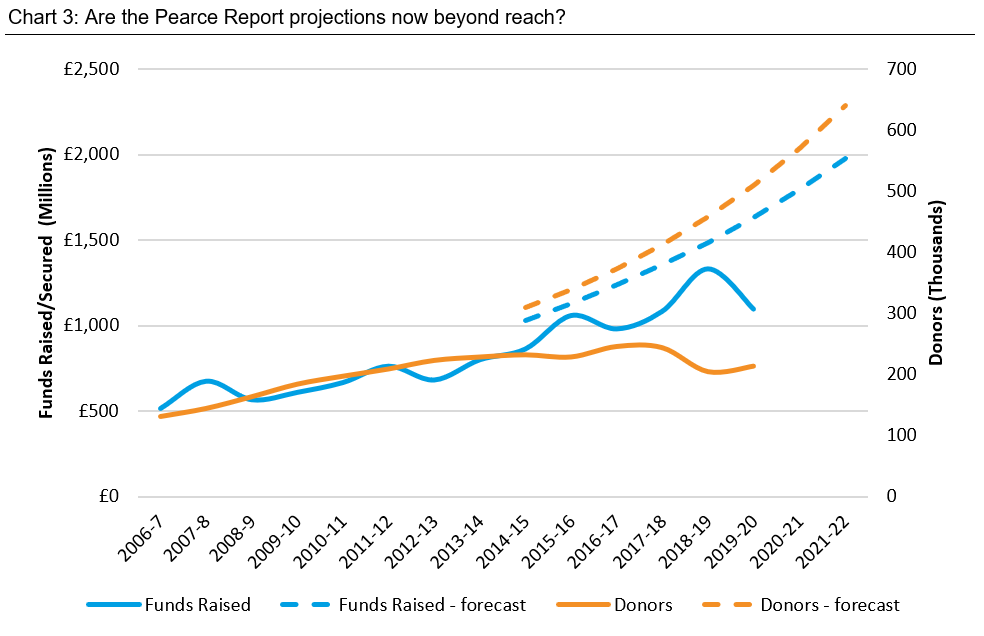
The required projections for donor numbers have been looking overly optimistic for some time and now we must conclude that, unless there is a dramatic step-change in philanthropic fundraising, it’s time to re-calibrate the expectations for the Funds Raised/Secured total as well.
It’s good to have ambitious targets, but there comes a time when you must accept that they’re out of reach. At least the trend line for both is upwards, and that’s despite falling numbers of institutions contributing.
As ever, if anyone would like our help in understanding their own numbers in detail and identifying where they can make the most effective interventions in fundraising strategy, please get in touch.