Opinion
Is all as rosy as first appears in the CASE-Ross garden?
by Paul Weighand, Adrian Beney and Siôn Lutley - 2 June 2020
Opinion
Is all as rosy as first appears in the CASE-Ross garden?
by Paul Weighand, Adrian Beney and Siôn Lutley - 2 June 2020
Our Insight team takes a deeper dive into the 2020 CASE-Ross report of giving to UK universities.
On reading the figures from the most recent CASE-Ross Report 2020, some big numbers jump out. £1.3billion raised in total new funds. This is nearly £250m more than last year and a year on year increase of 23%. Cash receipts have also broken the £1bn barrier for the first time. Very impressive and positive news, but, as we’ll go on to discuss, this growth has not been evenly distributed!
On top of that, the total number of donors reported in the study this year was 204,967 with underlying data showing that the absolute figure including all 100 institutions was a whopping 376,256. Again, seemingly great news, although the overall number of donors is referenced sparingly in the published CASE report. This appears to be for good reason as there seem to have been some significant changes to the way the donor number has been calculated within a couple of larger institutions.
All in all, it makes year on year comparisons difficult. However, it does help to illustrate that overall, reassuringly, the amount of money being given to universities continues to grow.
Total Reported Fundraising Income
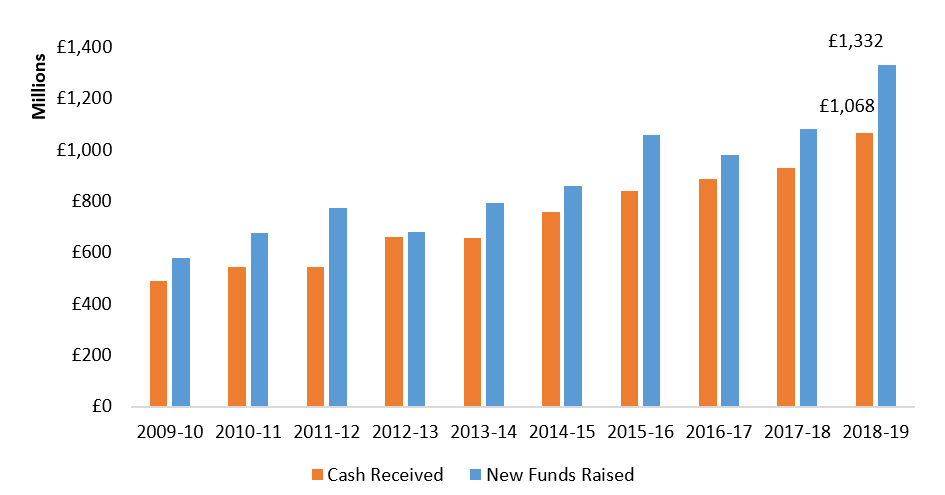
This chart shows totals from each year's survey rather than the totals for those that have taken part in every year. Some years will contain more reporting institutions than others. Oxbridge and almost all of the Russell Group have taken part in each year for which data is presented, the resulting error is likely to be less than +/- £10m. This error does not change the interpretation of the data.
“Toto, I've a feeling we're not in Kansas anymore.”
We should pause at this point to reflect and remember that these numbers represent the fundraising picture up to 31 July 2019. Much has changed since and the impact of COVID-19 will be scrutinised in the months and years, to come with much interest. As the world adjusts to the ‘new normal’, so will fundraising – it already has, and will continue to evolve and adapt.
However, you have to wonder whether 2018-19 will become the last ‘normal’ year. Will fundraising (and the wider world) treat this as a speedbump, albeit a significant one, in the same way it recovered from the financial crisis of 2008-9 and other shocks to the world system beforehand – or does this mark a black swan moment in time?
Anyway, back to the 2020 report.
Maybe not all boats rise as quickly with the tide?
When taken as a whole, the headline figures mask the fact that there is not one homogenous HEI fundraising sector. Much of the overall trends witnessed can easily be driven by a small number of high-performing institutions. The majority of funds raised is concentrated in a few exceptionally successful programmes. Fundraising at Oxford and Cambridge combined now accounts for as much as 52% of all new funds raised and 57% of all donors reported. Any analysis must be viewed within this context.
Growth has not been uniformly experienced across the sector. The most recent years can best be broken down by summary groups looking at the two ‘elite’ fundraising institutions of Oxford and Cambridge along with the remaining Russell Group and all other reporting institutions.
New Funds Raised by Summary Group
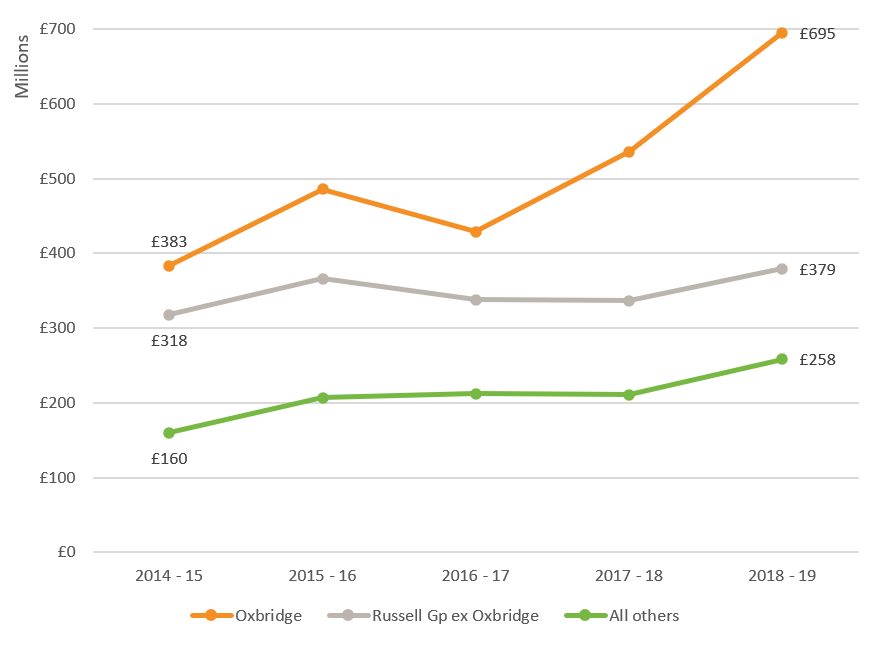
This highlights the noticeable difference in the contributions between each group and that most of the recent growth has been driven by significant gifts at Oxford and Cambridge. While Oxbridge and the non Russell Group institutions have seen steady growth over the past five years, the combined total for the remaining Russell Group institutions has been more variable. The funds raised by the Russell Group ex-Oxbridge have increased by around 20% since 2014-15 while Oxbridge has seen an increase of 80% and the ‘all others’ group has increased by 61%.
Gap in funds raised between Oxbridge and the rest of the Russell Group (£ millions)
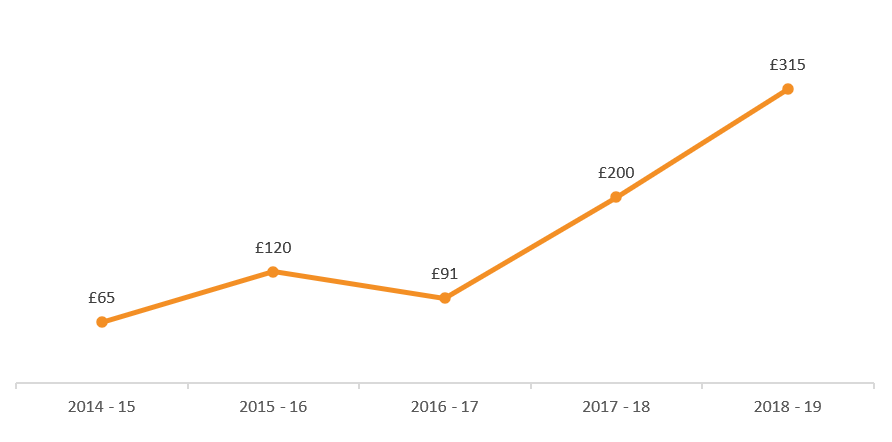
Indeed, the gap between Oxbridge and the rest of the Russell group is increasing, and not by small margins. This is best demonstrated by the chart above and the fact that, in 2014-15, the Russell Group contributed 37% of the total funds raised, whereas by 2018-19, it represented only 29% [NB: it should be noted that the non-Russell Group HEIs have been holding their own, contributing a fairly steady 19% of the total in both 2014-15 and 2018-19].
This growing disparity is driven, particularly in the latest report, by the very largest of gifts. The combined value of the pace-setting Harding gift to Cambridge and the Schwarzman gift to Oxford in the latest year was £250m, equivalent to the total increase in new funds raised in 2018-19 by all institutions.
The report notes that the average number of alumni donors across the sector rose by 2% this year. This follows a decline of 4% in the previous year. In relation to this seemingly small increase, the report’s commentary poses the question, ‘are annual funds slowing’? Well let's deal with that.
Annual Funds – so what’s really going on?
Leaving the dominance of Oxbridge over the numbers aside, it is possible to look beyond at the most recent shifts in other parts of the sector. Using the Pearce Report groupings, based on age of foundation, we can see a variation in the total number of donors reported in the last two years.
Average Total Donors by Pearce Report Grouping
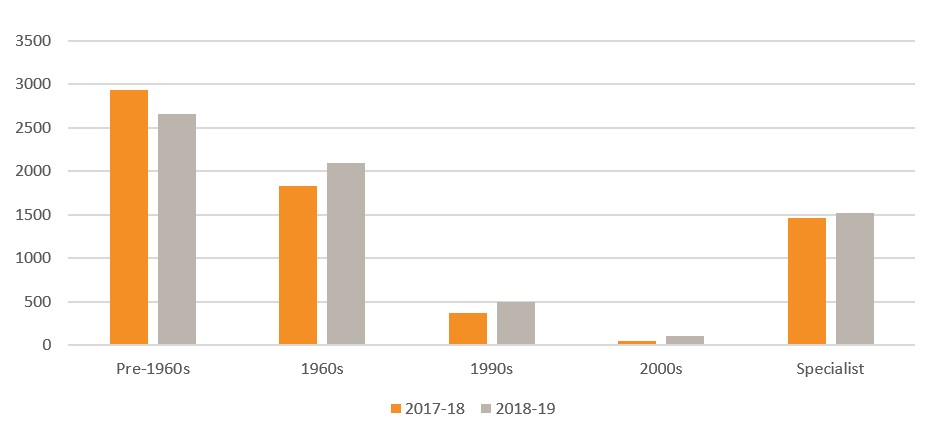
While overall donor numbers are reported to have risen by 1.34%, again, this is not an experience shared by all. The average number of donors reported by the 32 pre-1960s institutions included in the survey has dropped from 2,936 to 2,665 in the most recent year – a fall of 9%. Focussing in on alumni donors only, there is a smaller decline of 2% in the average for pre-1960s institutions.
Digging a bit further into the cluster analysis conducted by CASE shows that the picture also varies and that the bulk of the slowdown in alumni donor number growth is driven by those institutions in the Established cluster.
Mean percentage change in alumni donor numbers by cluster
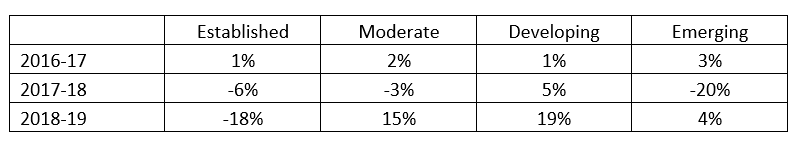
The Established cluster (consisting of the eight largest programmes outside Oxbridge) have seen the sharpest decline – 18% - in the number of alumni giving in the latest year, following a 6% decline in the previous year. 87% of these programmes have been in operation for 20 or more years and three quarters of them are Russell Group institutions. They make up a significant proportion of alumni donors overall and therefore have a major influence on the sector average. All other clusters have seen above average growth in alumni giving in the latest year.
More Partnership’s extensive analysis of regular giving data suggest this is only part of the story. It is true that we have found through our Regular Giving Benchmarking study that alumni donor numbers have declined by 17% since 2016-17. But does this mean that ‘Annual Funds are slowing?’ We think not. Aside from our distaste for the term ‘Annual Fund’ (given that the most loyal donors almost all give monthly) donor numbers are not the only story. Indeed, it is arguable that the drive for donor numbers in regular giving programmes that was seen up to 2016 or so allowed the focus on revenue to be lost.
While donor numbers have fallen, we have seen that average gift size has grown. The average gift measured in More Partnership’s Regular Giving Benchmarking programme for those giving less than £10k has increased year on year, growing by 20% since 2016-17.
And, in the same way that the very large gifts at Oxford and Cambridge have a disproportionate impact on the overall funds raised, hiatus of various kinds at a small number of high performing Regular Giving Programmes have a disproportionate impact on overall alumni donor numbers. Two or three of these have adopted a very cautious regulatory approach in respect of telephone and email fundraising, while another radically changed the emphasis of its programme. Four years ago, three of these institutions accounted for a fifth of all Russell Group alumni donors, and all have seen substantial drops in donor numbers.
So, fewer donors yes, but those donors give more and, as a result, regular giving income has held steady or slightly increased since 2016-17. An emphasis on long-term donor value, loyalty and retention has become more important – and more effective – than the drive for new donor acquisition. And fundraising prompted by Covid-19 is developing synergies with regular giving and major gifts working together where once they were in a degree of competition with each other for prospective donors. Thus, to paraphrase Mark Twain, we believe that rumours of the death of the ‘Annual Fund’ have been greatly exaggerated.
And finally…
For those who track the tracking, we’ve updated the chart we first produced for the Pearce Report in 2012, showing the forward trends required to reach by 2022 the sector’s goals for philanthropic revenue and donor numbers. The absolute accuracy of this chart is a little subject to the ups and downs of participation in the survey itself, but most of those raising the most, and acquiring the most donors, are represented in each year of data.
Projections beyond 2019 - including Oxbridge
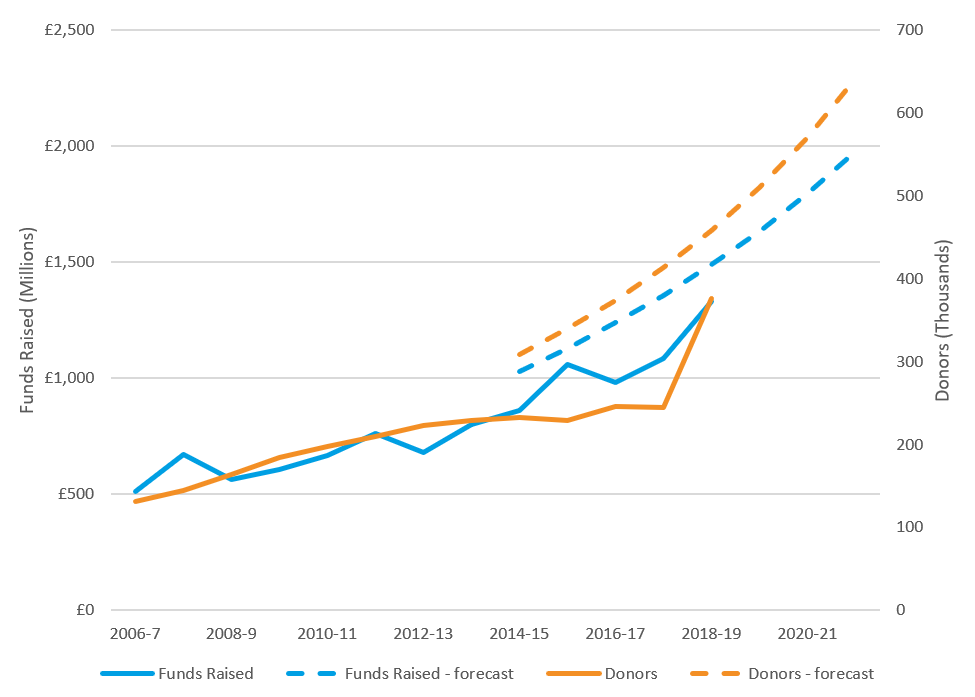
Onward and upward it is – even if a little more doggedly than the original target lines.
As ever, if anyone would like our help in understanding their own numbers in detail and identifying where they can make the most effective interventions in fundraising strategy, please get in touch.